日志收集分析工具logstash + elasticsearch
来源:程序员人生 发布时间:2015-01-04 09:26:50 阅读次数:4772次
Your logs are your data: logstash + elasticsearch
by
Andrey Redko
on February 25th, 2013
| Filed in:
Enterprise Java
Tags: Elasticsearch,
Logging,
Logstash
Topic of today’s post stays a bit aside from day-to-day coding and development but nonetheless covers a very important subject: our application log files. Our apps do generate enormous amount of logs which if done right are extremely handy for problems troubleshooting.
It’s not a big deal if you have a single application up and running, but nowadays apps, particularity webapps, run on hundreds of servers. With such a scale figuring out where is a problem becomes a challenge. Wouldn’t it be nice to have some kind of a view
which aggregates all logs from all our running applications into single dashboard so we could see a whole picture constructed from the pieces? Please welcome:
Logstash, the logs aggregation framework.
Although it’s not the only solution available, I found
Logstash to be very easy to use and extremely simple to integrate. To start with, we don’t even need to do anything on the application side,
Logstash can do all the job for us. Let me introduce the sample project: standalone Java application which has some multithreading activity going on. There is a logging to the file configured using great
Logback library (SLF4J could be used as a seamless replacement). The POM file looks pretty simple:
<project
xmlns="http://maven.apache.org/POM/4.0.0"
xmlns:xsi="http://www.w3.org/2001/XMLSchema-instance"
xsi:schemalocation="http://maven.apache.org/POM/4.0.0
http://maven.apache.org/xsd/maven⑷.0.0.xsd">
02 |
<modelversion>4.0.0</modelversion> |
04 |
<groupid>com.example</groupid> |
05 |
<artifactid>logstash</artifactid> |
06 |
<version>0.0.1-SNAPSHOT</version> |
07 |
<packaging>jar</packaging> |
10 |
<project.build.sourceencoding>UTF⑻</project.build.sourceencoding> |
11 |
<logback.version>1.0.6</logback.version> |
16 |
<groupid>ch.qos.logback</groupid> |
17 |
<artifactid>logback-classic</artifactid> |
18 |
<version>${logback.version}</version> |
22 |
<groupid>ch.qos.logback</groupid> |
23 |
<artifactid>logback-core</artifactid> |
24 |
<version>${logback.version}</version> |
31 |
<groupid>org.apache.maven.plugins</groupid> |
32 |
<artifactid>maven-compiler-plugin</artifactid> |
33 |
<version>3.0</version> |
And there is only one Java class called
Starter which uses
Executors services to do some work concurrently. For sure, each thread does some logging and from time to time there is an exception thrown.
01 |
package com.example.logstash; |
03 |
import java.util.ArrayList; |
04 |
import java.util.Collection; |
05 |
import java.util.Random; |
06 |
import java.util.concurrent.Callable; |
07 |
import java.util.concurrent.ExecutionException; |
08 |
import java.util.concurrent.ExecutorService; |
09 |
import java.util.concurrent.Executors; |
10 |
import java.util.concurrent.Future; |
11 |
import java.util.concurrent.TimeUnit; |
12 |
import java.util.concurrent.TimeoutException; |
14 |
import org.slf4j.Logger; |
15 |
import org.slf4j.LoggerFactory; |
17 |
public class
Starter { |
18 |
private
final static
Logger log = LoggerFactory.getLogger( Starter.class
); |
20 |
public
static void
main( String[] args ) { |
21 |
final
ExecutorService executor = Executors.newCachedThreadPool(); |
22 |
final
Collection< Future< Void > > futures = new
ArrayList< Future< Void > >(); |
23 |
final
Random random = new
Random(); |
25 |
for(
int i = 0; i <
10; ++i ) { |
28 |
new
Callable< Void >() { |
29 |
public
Void call() throws
Exception { |
30 |
int
sleep = Math.abs( random.nextInt( 10000
) % 10000
); |
31 |
log.warn(
'Sleeping for ' + sleep +
'ms' ); |
32 |
Thread.sleep( sleep ); |
40 |
for(
final Future< Void > future: futures ) { |
42 |
Void result = future.get(
3, TimeUnit.SECONDS ); |
43 |
log.info(
'Result ' + result ); |
44 |
}
catch (InterruptedException | ExecutionException | TimeoutException ex ) { |
45 |
log.error( ex.getMessage(), ex ); |
The idea is to demonstrate not only simple one-line logging events but famous Java stack traces. As every thread sleeps for random time interval, it causes TimeoutException to be thrown whenever the result of computation is being asked from the underlying
future object and taken more than 3 seconds to return. The last part is
Logback configuration (logback.xml):
01 |
<configuration
scan="true"
scanperiod="5 seconds"> |
02 |
<appender
name="FILE"
class="ch.qos.logback.core.FileAppender"> |
03 |
<file>/tmp/application.log</file> |
06 |
<pattern>[%level] %d{yyyy-MM-dd HH:mm:ss.SSS} [%thread] %logger{36} - %msg%n</pattern> |
11 |
<appender-ref
ref="FILE"> |
12 |
</appender-ref></root> |
And we are good to go! Please note that file path /tmp/application.log corresponds to
c: mpapplication.log on Windows. Running our application would fill log file with something like that:
01 |
[WARN] 2013-02⑴9 19:26:03.175 [pool⑵-thread⑴] com.example.logstash.Starter - Sleeping
for 2506ms |
02 |
[WARN] 2013-02⑴9 19:26:03.175 [pool⑵-thread⑷] com.example.logstash.Starter - Sleeping
for 9147ms |
03 |
[WARN] 2013-02⑴9 19:26:03.175 [pool⑵-thread⑼] com.example.logstash.Starter - Sleeping
for 3124ms |
04 |
[WARN] 2013-02⑴9 19:26:03.175 [pool⑵-thread⑶] com.example.logstash.Starter - Sleeping
for 6239ms |
05 |
[WARN] 2013-02⑴9 19:26:03.175 [pool⑵-thread⑸] com.example.logstash.Starter - Sleeping
for 4534ms |
06 |
[WARN] 2013-02⑴9 19:26:03.175 [pool⑵-thread⑴0] com.example.logstash.Starter - Sleeping
for 1167ms |
07 |
[WARN] 2013-02⑴9 19:26:03.175 [pool⑵-thread⑺] com.example.logstash.Starter - Sleeping
for 7228ms |
08 |
[WARN] 2013-02⑴9 19:26:03.175 [pool⑵-thread⑹] com.example.logstash.Starter - Sleeping
for 1587ms |
09 |
[WARN] 2013-02⑴9 19:26:03.175 [pool⑵-thread⑻] com.example.logstash.Starter - Sleeping
for 9457ms |
10 |
[WARN] 2013-02⑴9 19:26:03.176 [pool⑵-thread⑵] com.example.logstash.Starter - Sleeping
for 1584ms |
11 |
[INFO] 2013-02⑴9 19:26:05.687 [main] com.example.logstash.Starter - Result null |
12 |
[INFO] 2013-02⑴9 19:26:05.687 [main] com.example.logstash.Starter - Result null |
13 |
[ERROR] 2013-02⑴9 19:26:08.695 [main] com.example.logstash.Starter - null |
14 |
java.util.concurrent.TimeoutException: null |
15 |
at java.util.concurrent.FutureTask$Sync.innerGet(FutureTask.java:258) ~[na:1.7.0_13] |
16 |
at java.util.concurrent.FutureTask.get(FutureTask.java:119) ~[na:1.7.0_13] |
17 |
at com.example.logstash.Starter.main(Starter.java:43) ~[classes/:na] |
18 |
[ERROR] 2013-02⑴9 19:26:11.696 [main] com.example.logstash.Starter - null |
19 |
java.util.concurrent.TimeoutException: null |
20 |
at java.util.concurrent.FutureTask$Sync.innerGet(FutureTask.java:258) ~[na:1.7.0_13] |
21 |
at java.util.concurrent.FutureTask.get(FutureTask.java:119) ~[na:1.7.0_13] |
22 |
at com.example.logstash.Starter.main(Starter.java:43) ~[classes/:na] |
23 |
[INFO] 2013-02⑴9 19:26:11.696 [main] com.example.logstash.Starter - Result null |
24 |
[INFO] 2013-02⑴9 19:26:11.696 [main] com.example.logstash.Starter - Result null |
25 |
[INFO] 2013-02⑴9 19:26:11.697 [main] com.example.logstash.Starter - Result null |
26 |
[INFO] 2013-02⑴9 19:26:12.639 [main] com.example.logstash.Starter - Result null |
27 |
[INFO] 2013-02⑴9 19:26:12.639 [main] com.example.logstash.Starter - Result null |
28 |
[INFO] 2013-02⑴9 19:26:12.639 [main] com.example.logstash.Starter - Result null |
Now let’s see what
Logstash can do for us. From the download section, we get the single JAR file:
logstash⑴.1.9-monolithic.jar. That’s all we need for now. Unfortunately, because
of this bug on Windows we have to expand logstash⑴.1.9-monolithic.jar somewhere, f.e. into
logstash⑴.1.9-monolithic folder.
Logstash has just three concepts: inputs, filters and
outputs. Those are very well explained into the
documentation. In our case, the input is application’s log file, c: mpapplication.log. But what would be the output?
ElasticSearch seems to be an excellent candidate for that: let’s have our logs indexed and searchable any time. Let’s download and run it:
1 |
elasticsearch.bat -Des.index.store.type=memory -Des.network.host=localhost |
Now we are ready to integrate
Logstash which should tail our log file and feed it directly to
ElasticSearch. Following configuration does exactly that (logstash.conf):
03 |
add_field => [
'host', 'my-dev-host'
] |
04 |
path =>
'c: mpapplication.log' |
It might look not very clear on first glance but let me explain what is what. So the input is
c: mpapplication.log, which is a plain text file (format => ‘plain’). The
type => ‘app’ serves as simple marker so the different types of inputs could be routed to outputs through filters with the same type. The
add_field => [ ‘host’, ‘my-dev-host’ ] allows to inject additional arbitrary data into the incoming stream, f.e. hostname.
Output is pretty clear:
ElasticSearch over HTTP, port 9200 (default settings). Filters need a bit of magic, all because of Java stack traces. The
multiline filter will glue the stack trace to the log statement it belongs to so it will be stored as a single (large) multiline. Let’s run
Logstash:
1 |
java -cp logstash-1.1.9-monolithic logstash.runner agent -f logstash.conf |
Great! Now whenever we run our application,
Logstash will watch the log file, filter it property and send out directly to
ElasticSearch. Cool, but how can we do the search or at least see what kind of data do we have? Though
ElasticSearch has awesome REST API, we can use another excellent project,
Kibana, web UI front-end for
ElasticSearch. Installation is very straightforward and seamless. After a few necessary steps, we have
Kibana up and running:
By default,
Kibana provides the web UI available on port 5601, let’s point our browser to it,
http://localhost:5601/ and we should see something like that (please click on image to enlarge):
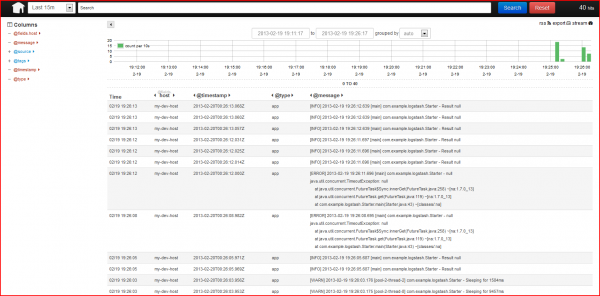
All our logs statements complemented by hostname are just there. Exceptions (with stack traces) are coupled with the related log statement. Log levels, timestamps, everything is being shown. Fulltext search is available out-of-the box, thanks to
ElasticSearch.
It’s all awesome but our application is very simple. Would this approach work across multi-server / multi-application deployment? I am pretty sure it will work just fine.
Logstash’s integration with
Redis,
ZeroMQ,
RabbitMQ, … allows to capture logs from tens of different sources and consolidate them in one place. Thanks a lot,
Logstash guys!
Reference: Your logs are your data: logstash + elasticsearch from our
JCG partner Andrey Redko at the
Andriy Redko {devmind} blog.
生活不易,码农辛苦
如果您觉得本网站对您的学习有所帮助,可以手机扫描二维码进行捐赠