Flume之监控
来源:程序员人生 发布时间:2016-06-03 07:59:26 阅读次数:15615次
Flume作为1个日志搜集工具,在数据收集方面,展现出了非常强大的能力。它的SOURCE、SINK、CHANNEL3大组件这类模式,来完成数据的接收、传输、发送这个进程,具有非常完善的契合度。不过这里,我们要说的不是Flume有多好或Flume有哪些优点,我们要谈的是Flume的监控。
1、为何需要Flume监控?
Flume作为1个强大的数据搜集工具,虽然功能非常强大实用,但是当需要看到flume搜集的数据信息的时候却没有1个界面能够展现出来,所以我们需要1个能展现flume实时搜集数据动态信息的界面,包括flume成功搜集的日志数量、成功发送的日志数量、flume启动时间、停止时间、和flume1些具体的配置信息,像通道容量等,因而顺利成章的监控能帮我们做到这些,有了这些数据,在遇到数据搜集瓶颈或数据丢失的时候,通过分析监控数据来分析、解决问题。
2、Flume有哪些监控方式?
(1)、Http监控
使用这类监控方式,只需要在启动flume的时候在启动参数上面加上监控配置,例如这样:
bin/flume-ng agent --conf conf --conf-file conf/flume_conf.properties --name collect -Dflume.monitoring.type=http -Dflume.monitoring.port=1234
其中-Dflume.monitoring.type=http表示使用http方式来监控,后面的-Dflume.monitoring.port=1234表示我们需要启动的监控服务的端口号为1234,这个端口号可以自己随便配置。然后启动flume以后,通过http://ip:1234/metrics就能够得到flume的1个json格式的监控数据。
(2)、ganglia监控
这类监控方式需要先安装ganglia然后启动ganglia,然后再启动flume的时候加上监控配置,例如:
bin/flume-ng agent --conf conf --conf-file conf/producer.properties --name collect -Dflume.monitoring.type=ganglia -Dflume.monitoring.hosts=ip:port
其中-Dflume.monitoring.type=ganglia表示使用ganglia的方式来监控,而-Dflume.monitoring.hosts=ip:port表示ganglia安装的ip和启动的端口号。
flume监控还可使用zabbix,但是这类方式需要在flume源码中添加监控模块,相对照较麻烦,由于不是flume自带的监控方式,这里不讨论这类方式。
因此,flume自带的监控方式其实就是http、ganglia两种,http监控只能通过1个http地址访问得到1个json格式的监控数据,而ganglia监控是拿到这个数据后用界面的方式展现出来了,相对照较直观。
3、Flume监控哪些组件、能够得到组件的哪些信息?
(1)、SOURCE
SOURCE作为flume的数据源组件,所有搜集日志的第1个到达的地方,它的监控信息非常重要。通过监控我们能够得到的监控数据有这些:
OpenConnectionCount(打开的连接数)、Type(组件类型)、AppendBatchAcceptedCount(追加到channel中的批数量)、AppendBatchReceivedCount(source端刚刚追加的批数量)、EventAcceptedCount(成功放入channel的event数量)、AppendReceivedCount(source追加目前收到的数量)、StartTime(组件开始时间)、StopTime(组件停止时间)、EventReceivedCount(source端成功收到的event数量)、AppendAcceptedCount(放入channel的event数量)等。固然这些只是flume监控源码中已自带的监控元素,如果你需要其他的监控信息,例如ip、端口号等,有两种方法,第1个,修改监控源码,添加你需要的监控元素,这类方法只是在原有代码基础上,添加1些满足自己需求的监控元素,比较简单,但灵活性不足;第2个就是自定义监控组件,这类方法是在原有监控框架中,自己实现自己的监控组件,这样可以到达完全满足自己需求,且灵活性很高。至于这两种方法如何操作,在后面Flume监控如何实现有讨论到。
同理CHANNEL、SINK这两个组件的监控也能够使用这两种方法来添加自己想要的监控元素。
(2)、CHANNEL
CHANNEL是flume的1个通道组件,对数据有1个缓存的作用。能够得到的数据:
EventPutSuccessCount(成功放入channel的event数量)、ChannelFillPercentage(通道使用比例)、Type(组件类型)、EventPutAttemptCount(尝试放入将event放入channel的次数)、ChannelSize(目前在channel中的event数量)、StartTime(组件开始时间)、StopTime(组件停止时间)、EventTakeSuccessCount(从channel中成功取走的event数量)、ChannelCapacity(通道容量)、EventTakeAttemptCount(尝试从channel中取走event的次数)等。
(3)、SINK
SINK是数据行将离开flume的最后1个组件,它从channel中取走数据,然后发送到缓存系统或持久化
数据库。能得到数据:
BatchCompleteCount(完成的批数量)、ConnectionFailedCount(连接失败数)、EventDrainAttemptCount(尝试提交的event数量)、ConnectionCreatedCount(创建连接数)、Type(组件类型)、BatchEmptyCount(批量取空的数量)、ConnectionClosedCount(关闭连接数量)、EventDrainSuccessCount(成功发送event的数量)、StartTime(组件开始时间)、StopTime(组件停止时间)、BatchUnderflowCount(正处于批量处理的batch数)等。
4、Flume监控是如何实现的?
首先在flume-ng-node中org.apache.flume.node.Application的main方法中,有1个startAllComponents()方法:
private void startAllComponents(
MaterializedConfiguration materializedConfiguration) {
logger.info("Starting new configuration:{}", materializedConfiguration);
this.materializedConfiguration = materializedConfiguration;
for (Entry<String, Channel> entry : materializedConfiguration
.getChannels().entrySet()) {
try {
logger.info("Starting Channel " + entry.getKey());
supervisor.supervise(entry.getValue(),
new SupervisorPolicy.AlwaysRestartPolicy(),
LifecycleState.START);
} catch (Exception e) {
logger.error("Error while starting {}", entry.getValue(), e);
}
}
/*
* Wait for all channels to start.
*/
for (Channel ch : materializedConfiguration.getChannels().values()) {
while (ch.getLifecycleState() != LifecycleState.START
&& !supervisor.isComponentInErrorState(ch)) {
try {
logger.info("Waiting for channel: " + ch.getName()
+ " to start. Sleeping for 500 ms");
Thread.sleep(500);
} catch (InterruptedException e) {
logger.error(
"Interrupted while waiting for channel to start.",
e);
Throwables.propagate(e);
}
}
}
for (Entry<String, SinkRunner> entry : materializedConfiguration
.getSinkRunners().entrySet()) {
try {
logger.info("Starting Sink " + entry.getKey());
supervisor.supervise(entry.getValue(),
new SupervisorPolicy.AlwaysRestartPolicy(),
LifecycleState.START);
} catch (Exception e) {
logger.error("Error while starting {}", entry.getValue(), e);
}
}
for (Entry<String, SourceRunner> entry : materializedConfiguration
.getSourceRunners().entrySet()) {
try {
logger.info("Starting Source " + entry.getKey());
supervisor.supervise(entry.getValue(),
new SupervisorPolicy.AlwaysRestartPolicy(),
LifecycleState.START);
} catch (Exception e) {
logger.error("Error while starting {}", entry.getValue(), e);
}
}
this.loadMonitoring();
}
其中有1个this.loadMonitoring();来启动监控方法loadMonitoring():
private void loadMonitoring() {
Properties systemProps = System.getProperties();
Set<String> keys = systemProps.stringPropertyNames();
try {
if (keys.contains(CONF_MONITOR_CLASS)) {
String monitorType = systemProps
.getProperty(CONF_MONITOR_CLASS);
Class<? extends MonitorService> klass;
try {
// Is it a known type?
klass = MonitoringType.valueOf(monitorType.toUpperCase())
.getMonitorClass();
} catch (Exception e) {
// Not a known type, use FQCN
klass = (Class<? extends MonitorService>) Class
.forName(monitorType);
}
this.monitorServer = klass.newInstance();
Context context = new Context();
for (String key : keys) {
if (key.startsWith(CONF_MONITOR_PREFIX)) {
context.put(
key.substring(CONF_MONITOR_PREFIX.length()),
systemProps.getProperty(key));
}
}
monitorServer.configure(context);
monitorServer.start();
}
} catch (Exception e) {
logger.warn("Error starting monitoring. "
+ "Monitoring might not be available.", e);
}
}
其中monitorServer.configure(context);来加载监控服务的配置信息,monitorServer.start();启动监控服务。
这里的monitorServer就会有两种:GangliaServer和HTTPMetricsServer,他们都实现了MonitorService这个接口。这里我们只追踪HTTPMetricsServer。
我们先看HTTPMetricsServer的源码:
public class HTTPMetricsServer implements MonitorService {
private Server jettyServer;
private int port;
private static Logger LOG = LoggerFactory.getLogger(HTTPMetricsServer.class);
public static int DEFAULT_PORT = 41414;
public static String CONFIG_PORT = "port";
@Override
public void start() {
jettyServer = new Server();
//We can use Contexts etc if we have many urls to handle. For one url,
//specifying a handler directly is the most efficient.
SelectChannelConnector connector = new SelectChannelConnector();
connector.setReuseAddress(true);
connector.setPort(port);
jettyServer.setConnectors(new Connector[] {connector});
jettyServer.setHandler(new HTTPMetricsHandler());
try {
jettyServer.start();
while (!jettyServer.isStarted()) {
Thread.sleep(500);
}
} catch (Exception ex) {
LOG.error("Error starting Jetty. JSON Metrics may not be available.", ex);
}
}
@Override
public void stop() {
try {
jettyServer.stop();
jettyServer.join();
} catch (Exception ex) {
LOG.error("Error stopping Jetty. JSON Metrics may not be available.", ex);
}
}
@Override
public void configure(Context context) {
port = context.getInteger(CONFIG_PORT, DEFAULT_PORT);
}
private class HTTPMetricsHandler extends AbstractHandler {
Type mapType =
new TypeToken<Map<String, Map<String, String>>>() {
}.getType();
Gson gson = new Gson();
@Override
public void handle(String target,
HttpServletRequest request,
HttpServletResponse response,
int dispatch) throws IOException, ServletException {
// /metrics is the only place to pull metrics.
//If we want to use any other url for something else, we should make sure
//that for metrics only /metrics is used to prevent backward
//compatibility issues.
if(request.getMethod().equalsIgnoreCase("TRACE") || request.getMethod()
.equalsIgnoreCase("OPTIONS")) {
response.sendError(HttpServletResponse.SC_FORBIDDEN);
response.flushBuffer();
((Request) request).setHandled(true);
return;
}
if (target.equals("/")) {
response.setContentType("text/html;charset=utf⑻");
response.setStatus(HttpServletResponse.SC_OK);
response.getWriter().write("For Flume metrics please click"
+ " <a href = \"./metrics\"> here</a>.");
response.flushBuffer();
((Request) request).setHandled(true);
return;
} else if (target.equalsIgnoreCase("/metrics")) {
response.setContentType("application/json;charset=utf⑻");
response.setStatus(HttpServletResponse.SC_OK);
Map<String, Map<String, String>> metricsMap = JMXPollUtil.getAllMBeans();
String json = gson.toJson(metricsMap, mapType);
response.getWriter().write(json);
response.flushBuffer();
((Request) request).setHandled(true);
return;
}
response.sendError(HttpServletResponse.SC_NOT_FOUND);
response.flushBuffer();
//Not handling the request returns a Not found error page.
}
}
}
其中会初始化1个jettyServer来提供监控数据的访问服务,里面的核心方法还是handle方法,定义了监控数据访问的url,这里的url就是获得监控json格式数据的http地址。那这些监控数据是如何得到的呢?
通过源码我们可以看到Map<String, Map<String, String>> metricsMap = JMXPollUtil.getAllMBeans();具体的数据都是从这条语句得来的,再仔细看可以得知,这些监控数据是同JMX的方式得到的。至于里面具体实现的细节,相对照较复杂,同时也不属于我们讨论的范畴,所以这里不讨论这块。
除以上的源码,我们需要关注之外,我们还需要关注具体监控组件的源码,这些源码都是在flume-ng-core中的org.apache.flume.instrumentation包下面,所有的监控组件都会继承MonitoredCounterGroup实现xxxCounterMBean接口,MonitoredCounterGroup中定义了1些基本公有的监控属性,xxxCounterMBean定义了获得监控元素的方法接口,具体实现还是在监控组件中实现。我们看MonitoredCounterGroup的源码:
public abstract class MonitoredCounterGroup {
private static final Logger logger =
LoggerFactory.getLogger(MonitoredCounterGroup.class);
// Key for component's start time in MonitoredCounterGroup.counterMap
private static final String COUNTER_GROUP_START_TIME = "start.time";
// key for component's stop time in MonitoredCounterGroup.counterMap
private static final String COUNTER_GROUP_STOP_TIME = "stop.time";
private final Type type;
private final String name;
private final Map<String, AtomicLong> counterMap;
private AtomicLong startTime;
private AtomicLong stopTime;
private volatile boolean registered = false;
protected MonitoredCounterGroup(Type type, String name, String... attrs) {
this.type = type;
this.name = name;
Map<String, AtomicLong> counterInitMap = new HashMap<String, AtomicLong>();
// Initialize the counters
for (String attribute : attrs) {
counterInitMap.put(attribute, new AtomicLong(0L));
}
counterMap = Collections.unmodifiableMap(counterInitMap);
startTime = new AtomicLong(0L);
stopTime = new AtomicLong(0L);
}
/**
* Starts the component
*
* Initializes the values for the stop time as well as all the keys in the
* internal map to zero and sets the start time to the current time in
* milliseconds since midnight January 1, 1970 UTC
*/
public void start() {
register();
stopTime.set(0L);
for (String counter : counterMap.keySet()) {
counterMap.get(counter).set(0L);
}
startTime.set(System.currentTimeMillis());
logger.info("Component type: " + type + ", name: " + name + " started");
}
/**
* Registers the counter.
* This method is exposed only for testing, and there should be no need for
* any implementations to call this method directly.
*/
@VisibleForTesting
void register() {
if (!registered) {
try {
ObjectName objName = new ObjectName("org.apache.flume."
+ type.name().toLowerCase() + ":type=" + this.name);
if (ManagementFactory.getPlatformMBeanServer().isRegistered(objName)) {
logger.debug("Monitored counter group for type: " + type + ", name: "
+ name + ": Another MBean is already registered with this name. "
+ "Unregistering that pre-existing MBean now...");
ManagementFactory.getPlatformMBeanServer().unregisterMBean(objName);
logger.debug("Monitored counter group for type: " + type + ", name: "
+ name + ": Successfully unregistered pre-existing MBean.");
}
ManagementFactory.getPlatformMBeanServer().registerMBean(this, objName);
logger.info("Monitored counter group for type: " + type + ", name: "
+ name + ": Successfully registered new MBean.");
registered = true;
} catch (Exception ex) {
logger.error("Failed to register monitored counter group for type: "
+ type + ", name: " + name, ex);
}
}
}
/**
* Shuts Down the Component
*
* Used to indicate that the component is shutting down.
*
* Sets the stop time and then prints out the metrics from
* the internal map of keys to values for the following components:
*
* - ChannelCounter
* - ChannelProcessorCounter
* - SinkCounter
* - SinkProcessorCounter
* - SourceCounter
*/
public void stop() {
// Sets the stopTime for the component as the current time in milliseconds
stopTime.set(System.currentTimeMillis());
// Prints out a message indicating that this component has been stopped
logger.info("Component type: " + type + ", name: " + name + " stopped");
// Retrieve the type for this counter group
final String typePrefix = type.name().toLowerCase();
// Print out the startTime for this component
logger.info("Shutdown Metric for type: " + type + ", "
+ "name: " + name + ". "
+ typePrefix + "." + COUNTER_GROUP_START_TIME
+ " == " + startTime);
// Print out the stopTime for this component
logger.info("Shutdown Metric for type: " + type + ", "
+ "name: " + name + ". "
+ typePrefix + "." + COUNTER_GROUP_STOP_TIME
+ " == " + stopTime);
// Retrieve and sort counter group map keys
final List<String> mapKeys = new ArrayList<String>(counterMap.keySet());
Collections.sort(mapKeys);
// Cycle through and print out all the key value pairs in counterMap
for (final String counterMapKey : mapKeys) {
// Retrieves the value from the original counterMap.
final long counterMapValue = get(counterMapKey);
logger.info("Shutdown Metric for type: " + type + ", "
+ "name: " + name + ". "
+ counterMapKey + " == " + counterMapValue);
}
}
/**
* Returns when this component was first started
*
* @return
*/
public long getStartTime() {
return startTime.get();
}
/**
* Returns when this component was stopped
*
* @return
*/
public long getStopTime() {
return stopTime.get();
}
@Override
public final String toString() {
StringBuilder sb = new StringBuilder(type.name()).append(":");
sb.append(name).append("{");
boolean first = true;
Iterator<String> counterIterator = counterMap.keySet().iterator();
while (counterIterator.hasNext()) {
if (first) {
first = false;
} else {
sb.append(", ");
}
String counterName = counterIterator.next();
sb.append(counterName).append("=").append(get(counterName));
}
sb.append("}");
return sb.toString();
}
/**
* Retrieves the current value for this key
*
* @param counter The key for this metric
* @return The current value for this key
*/
protected long get(String counter) {
return counterMap.get(counter).get();
}
/**
* Sets the value for this key to the given value
*
* @param counter The key for this metric
* @param value The new value for this key
*/
protected void set(String counter, long value) {
counterMap.get(counter).set(value);
}
/**
* Atomically adds the delta to the current value for this key
*
* @param counter The key for this metric
* @param delta
* @return The updated value for this key
*/
protected long addAndGet(String counter, long delta) {
return counterMap.get(counter).addAndGet(delta);
}
/**
* Atomically increments the current value for this key by one
*
* @param counter The key for this metric
* @return The updated value for this key
*/
protected long increment(String counter) {
return counterMap.get(counter).incrementAndGet();
}
/**
* Component Enum Constants
*
* Used by each component's constructor to distinguish which type the
* component is.
*/
public static enum Type {
SOURCE,
CHANNEL_PROCESSOR,
CHANNEL,
SINK_PROCESSOR,
SINK,
INTERCEPTOR,
SERIALIZER,
OTHER
};
public String getType(){
return type.name();
}
}
其中主要包括:
初始化构造方法protected MonitoredCounterGroup(Type type, String name, String... attrs):初始化组件类型,和1些监控元素;
启动方法start():启动监控组件;
停止方法stop():停止监控组件;
监控组件的注册方法register():监控组件必须在监控服务MBeanServer中注册以后才能正常监控。
然后我们看获得监控元素信息的方法接口,我们以SourceCounterMBean为例子:
public interface SourceCounterMBean {
long getEventReceivedCount();
long getEventAcceptedCount();
long getAppendReceivedCount();
long getAppendAcceptedCount();
long getAppendBatchReceivedCount();
long getAppendBatchAcceptedCount();
long getStartTime();
long getStopTime();
String getType();
long getOpenConnectionCount();
String getIp();
String getPort();
}
如果我们要自定义监控元素,除在监控组件(xxxCounter)中定义监控属性之外,在这里(xxxCounterMBean)也必须要定义1个获得值得方法。
我们以flume中AvroSource的监控为例子,监控对象是AvroSource,与监控有关的类有SourceCounter、SourceCounterMBean、MonitoredCounterGroup这3个,其中SourceCounter是我们的监控组件,它继承MonitoredCounterGroup并且实现SourceCounterMBean接口,具体要监控的元素是在SourceCounter、MonitoredCounterGroup这两个类中定义的,获得监控元素的方法是在SourceCounterMBean接口中定义的,然后我们会在AvroSource类中初始化1个我们的监控组件SourceCounter,所有的监控元素的值都是在监控对象AvroSource中设值,然后获得值是通过SourceCounterMBean的接口方法来获得。
具体的监控数据流向图:

熟习了以上的流程,我们也能够开发自己想要的监控组件,得到完全满足自己需求的所有监控元素。
这里如果只是在原有基础之上添加1些组件的监控元素,比较简单,只需要在监控组件(xxxCounter)中添加你需要的监控元素属性,然后在(xxxCounterMBean)中添加get方法(只有这里添加get方法,JMX监控服务才能顺利获得到值),然后在相应的组件(source、channel、sink)中set值。
如果是自定义监控组件,你只需要添加xxxCounter、xxxCounterMBean,和你自定义的xxx(source、channel、sink),这里需要注意1点,就是命名规范的问题,需要严格依照上面的命令规范JMX才能正常辨认。例如,这里如果你把获得值得接口类xxxCounterMBean命名为xxxCounterMbean,这样就出问题。
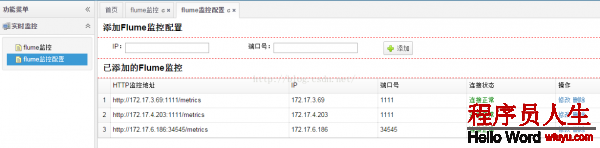
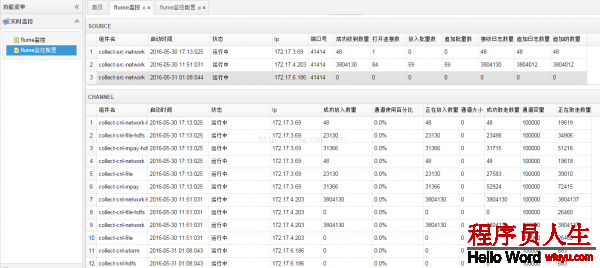
flume监控数据截图:

flume监控web页面:
生活不易,码农辛苦
如果您觉得本网站对您的学习有所帮助,可以手机扫描二维码进行捐赠